

REIT Performance
REITs averaged a +3.19% total return in November and have now finished in the black in 6 of the past 7 months. Despite the solid performance, REITs fell short of the broader market as November yielded excellent returns for the Dow Jones Industrial Average (+7.7%), NASDAQ (+6.3%) and S&P 500 (+5.9%). The market cap weighted Vanguard Real Estate ETF (VNQ) outpaced the average REIT in November (+4.26% vs. +3.19%) and has handily outperformed year-to-date (+14.39% vs. +10.45%). The spread between the 2025 FFO multiples of large cap REITs (18.6x) and small cap REITs (14.4x) remained steady in November, as multiples expanded 0.5 turns for both large caps and small caps. Investors currently need to pay an average of 29.2% more for each dollar of FFO from large cap REITs relative to small cap REITs. In this monthly publication, I will provide REIT data on numerous metrics to help readers identify which property types and individual securities currently offer the best opportunities to achieve their investment goals.
Source: Graph by Simon Bowler of 2nd Market Capital, Data compiled from S&P Global Market Intelligence LLC. See important notes and disclosures at the end of this article
Micro cap REITs (-0.81%) continue to lag their larger peers as November marked yet another month in the red. Small caps (+4.19%), mid caps (+3.70%) and large caps (+3.39%) all averaged strong November gains. Over the first 11 months of 2024, large cap REITs have outperformed small caps by 698 basis points.
Source: Graph by Simon Bowler of 2nd Market Capital, Data compiled from S&P Global Market Intelligence LLC. See important notes and disclosures at the end of this article
15 out of 18 Property Types Yielded Positive Total Returns in November
83.3% of REIT property types averaged a positive total return in November. There was a 16.66% total return spread between the best and worst performing property types. Malls (+13.78%) was the top-performing property type in November, led by double-digit gains from CBL & Associates Properties (CBL) (+18.35%) and Macerich (MAC) (+14.42%) while Simon Property Group (SPG) also turned in a strong +8.56% return.
Industrial (-2.88%), Diversified (-0.63%), and Health Care (-0.57%) were the only property types in negative territory in November.
Source: Table by Simon Bowler of 2nd Market Capital, Data compiled from S&P Global Market Intelligence LLC. See important notes and disclosures at the end of this article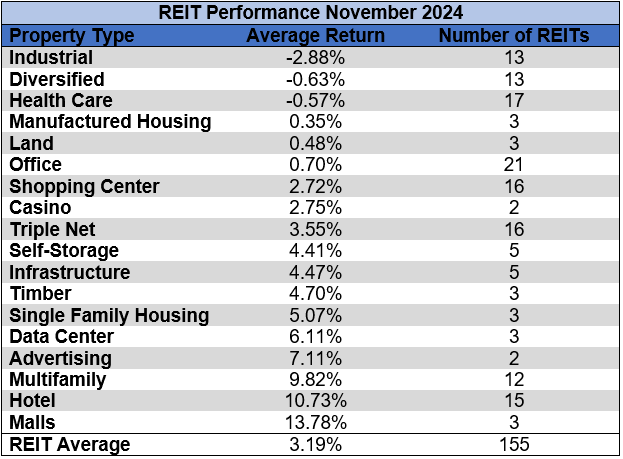
Land (-5.51%) and Timber (-4.11%) underperformed all other REIT property types over the first eleven months of 2024. Data Centers (+51.30%) and Advertising (+41.34%) have achieved the highest average returns in the REIT sector thus far this year.
Source: Table by Simon Bowler of 2nd Market Capital, Data compiled from S&P Global Market Intelligence LLC. See important notes and disclosures at the end of this article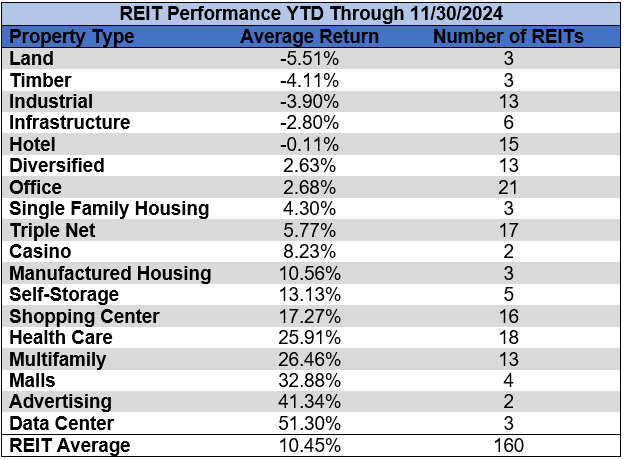
The REIT sector as a whole saw the average P/FFO (2025Y) increase 0.5 turns in November from 14.4x up to 14.9x. 72.2% of property types averaged multiple expansion, 22.2% saw multiple contraction and 5.6% saw multiples remain flat. Land (35.8x), Data Centers (33.1x), Multifamily (21.7x), Single Family Housing (20.5x) and Manufactured Housing (19.7x) currently trade at the highest average multiples among REIT property types. Hotels (7.6x) and Office (9.7x) are the only property types that average single digit FFO multiples.
Source: Table by Simon Bowler of 2nd Market Capital, Data compiled from S&P Global Market Intelligence LLC. See important notes and disclosures at the end of this article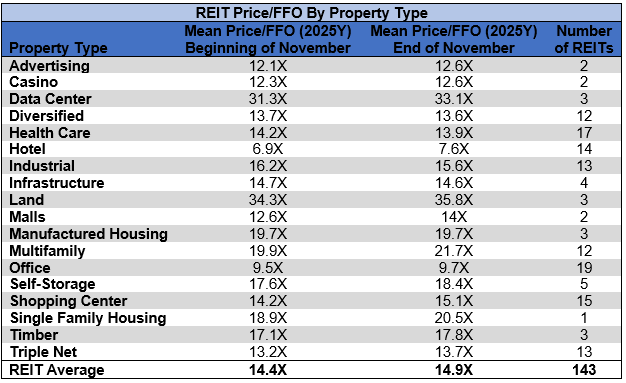
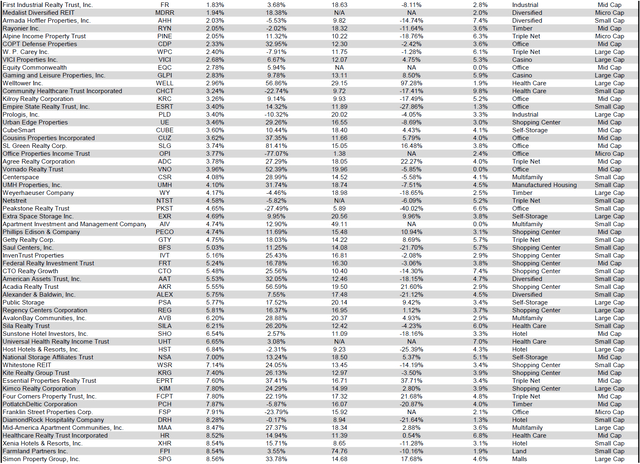
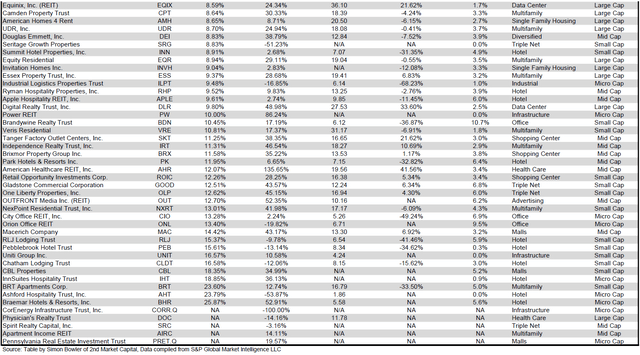
Performance of Individual Securities
Braemar Hotels & Resorts (BHR) (+25.87%) was the best performing REIT in November and has the 8th highest total return year-to-date (+52.91%). Despite posting a slight year-over-year decline in RevPAR (-1.6%), Braemar shares spiked higher after releasing Q3 earnings on November 7th.
Wheeler REIT (WHLR) (-51.63%) continued to free-fall as the share price declined almost every single trading day in November. Wheeler is now down -96.35% in 2024 as it continues to extend a multi-year streak of severe underperformance.
74.19% of REITs had a positive total return in November. During the first eleven months of 2023, REITs averaged a modestly negative return (-2.27%). The REIT sector has performed significantly better over the first 11 months of 2024 with a +10.45% average total return.
Source: Table by Simon Bowler of 2nd Market Capital, Data compiled from S&P Global Market Intelligence LLC. See important notes and disclosures at the end of this article Source: Table by Simon Bowler of 2nd Market Capital, Data compiled from S&P Global Market Intelligence LLC. See important notes and disclosures at the end of this article Source: Table by Simon Bowler of 2nd Market Capital, Data compiled from S&P Global Market Intelligence LLC. See important notes and disclosures at the end of this article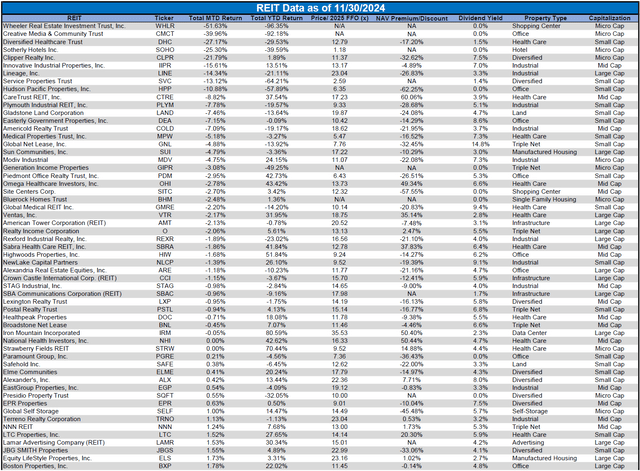
For the convenience of reading this table in a larger font, the table above is available as a PDF as well.
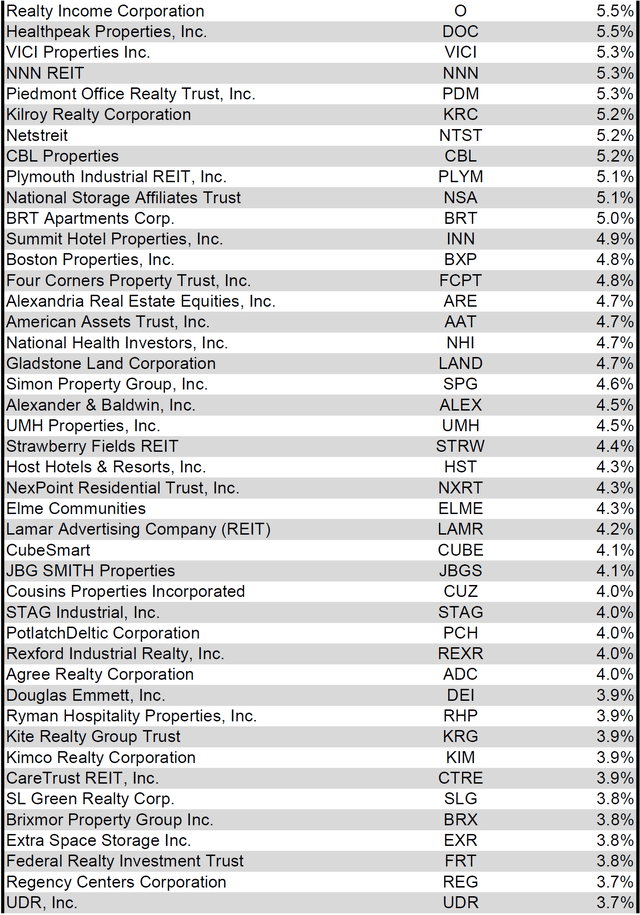
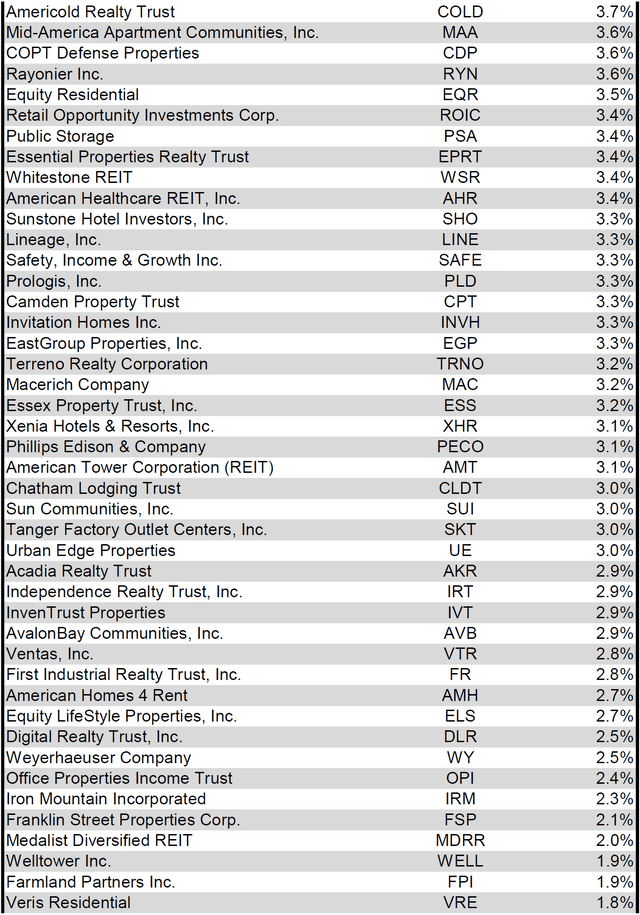
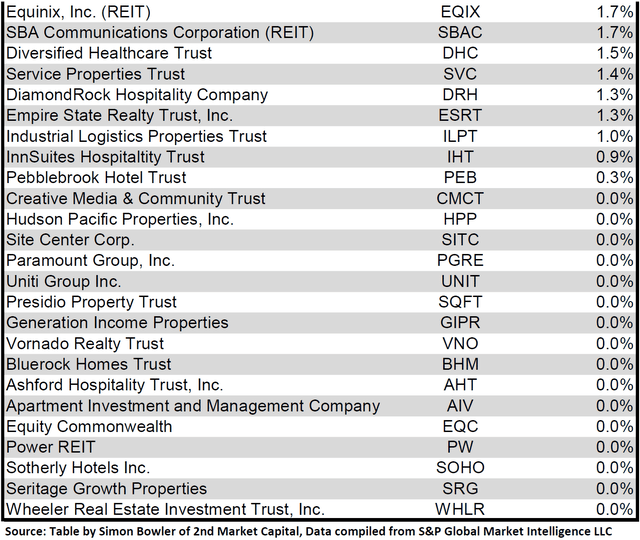
Dividend Yield
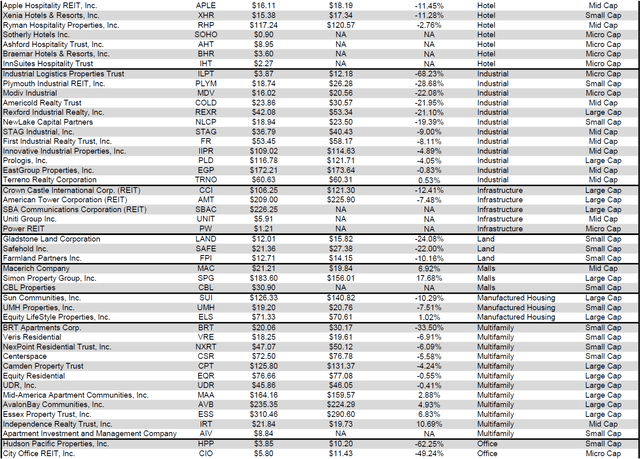
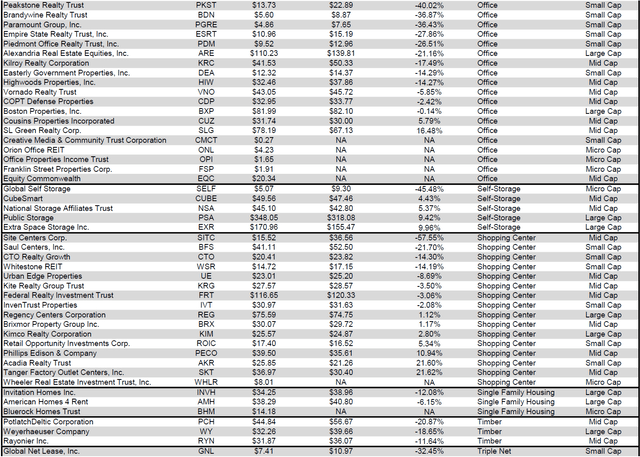
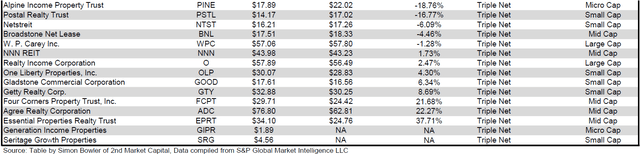
Dividend yield is an important component of a REIT’s total return. The particularly high dividend yields of the REIT sector are, for many investors, the primary reason for investment in this sector. As many REITs are currently trading at share prices well below their NAV, yields are currently quite high for many REITs within the sector. Although a particularly high yield for a REIT may sometimes reflect a disproportionately high risk, there exist opportunities in some cases to capitalize on dividend yields that are sufficiently attractive to justify the underlying risks of the investment. I have included below a table ranking equity REITs from the highest dividend yield (as of 11/30/2024) to the lowest dividend yield.
Source: Table by Simon Bowler of 2nd Market Capital, Data compiled from S&P Global Market Intelligence LLC. See important notes and disclosures at the end of this article Source: Table by Simon Bowler of 2nd Market Capital, Data compiled from S&P Global Market Intelligence LLC. See important notes and disclosures at the end of this article Source: Table by Simon Bowler of 2nd Market Capital, Data compiled from S&P Global Market Intelligence LLC. See important notes and disclosures at the end of this article Source: Table by Simon Bowler of 2nd Market Capital, Data compiled from S&P Global Market Intelligence LLC. See important notes and disclosures at the end of this article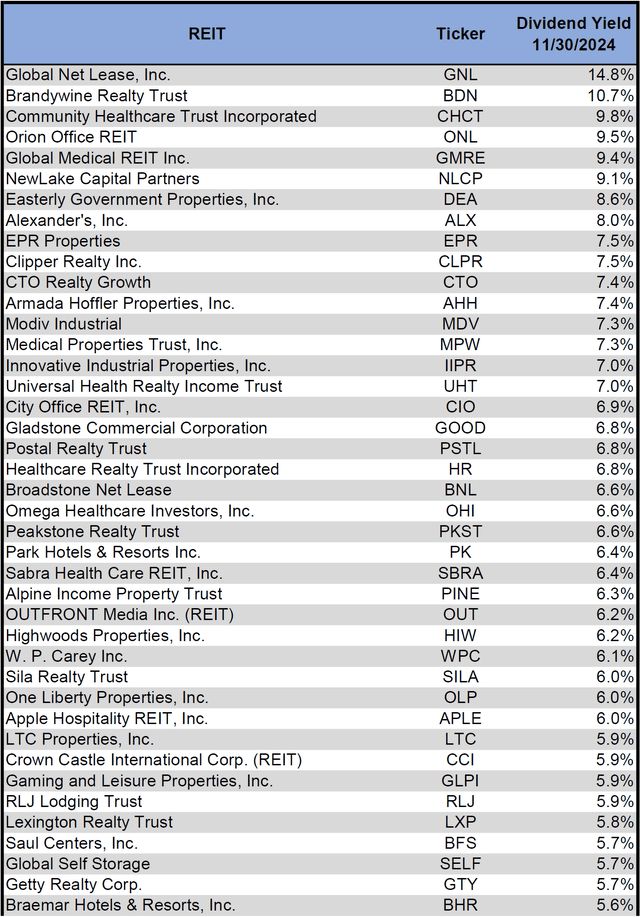
For the convenience of reading this table in a larger font, the table above is available as a PDF as well.
Although a REIT’s decision regarding whether to pay a quarterly dividend or a monthly dividend does not reflect on the quality of the company’s fundamentals or operations, a monthly dividend allows for a smoother cash flow to the investor. Below is a list of equity REITs that pay monthly dividends, ranked from the highest yield to the lowest yield.
Source: Table by Simon Bowler of 2nd Market Capital, Data compiled from S&P Global Market Intelligence LLC. See important notes and disclosures at the end of this article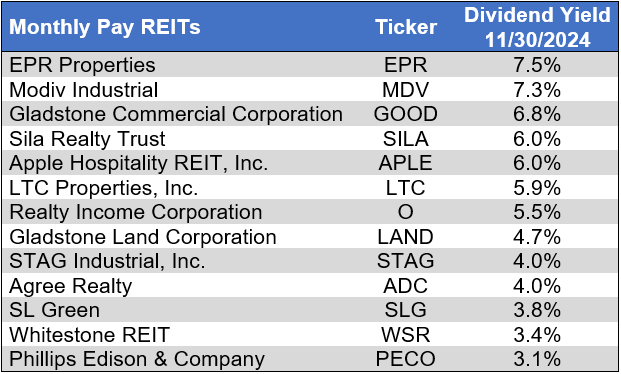
Valuation
REIT Premium/Discount to NAV by Property Type
Below is a downloadable data table, which ranks REITs within each property type from the largest discount to the largest premium to NAV. The consensus NAV used for this table is the average of analyst NAV estimates for each REIT. Both the NAV and the share price will change over time, so I will continue to include this table in upcoming issues of The State of REITs with updated consensus NAV estimates for each REIT for which such an estimate is available.
Source: Table by Simon Bowler of 2nd Market Capital, Data compiled from S&P Global Market Intelligence LLC. See important notes and disclosures at the end of this article Source: Table by Simon Bowler of 2nd Market Capital, Data compiled from S&P Global Market Intelligence LLC. See important notes and disclosures at the end of this article Source: Table by Simon Bowler of 2nd Market Capital, Data compiled from S&P Global Market Intelligence LLC. See important notes and disclosures at the end of this article Source: Table by Simon Bowler of 2nd Market Capital, Data compiled from S&P Global Market Intelligence LLC. See important notes and disclosures at the end of this article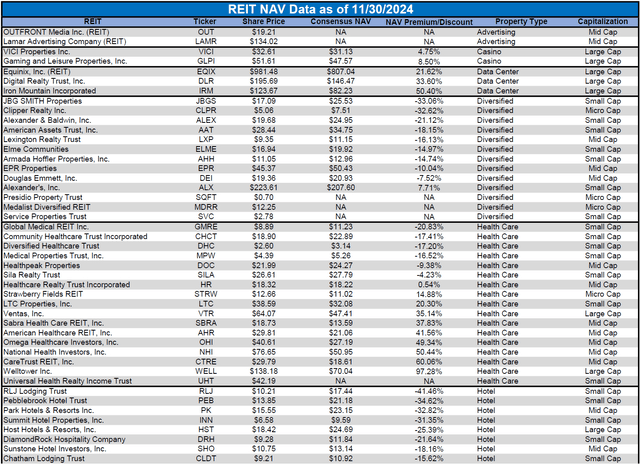
For the convenience of reading this table in a larger font, the table above is available as a PDF as well.
Takeaway
The large cap REIT premium (relative to small cap REITs) narrowed in November and investors are now paying on average about 29% more for each dollar of 2025 FFO/share to buy large cap REITs than small cap REITs (18.6x/14.4x – 1 = 29.2%). As can be seen in the table below, there is presently a strong positive correlation between market cap and FFO multiple.
Source: Table by Simon Bowler of 2nd Market Capital, Data compiled from S&P Global Market Intelligence LLC. See important notes and disclosures at the end of this article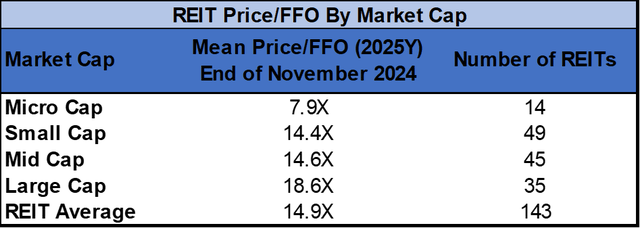
The table below shows the average NAV premium/discount of REITs of each market cap bucket. This data, much like the data for price/FFO, shows a strong, positive correlation between market cap and Price/NAV. The average large cap REIT (+4.19%) and mid cap REIT (+2.37%) trade at low single-digit premiums to NAV. Small cap REITs (-16.50%) trade at a double-digit NAV discount and micro caps (-31.65%) trade at just over 2/3 of their respective NAVs.
Source: Table by Simon Bowler of 2nd Market Capital, Data compiled from S&P Global Market Intelligence LLC. See important notes and disclosures at the end of this article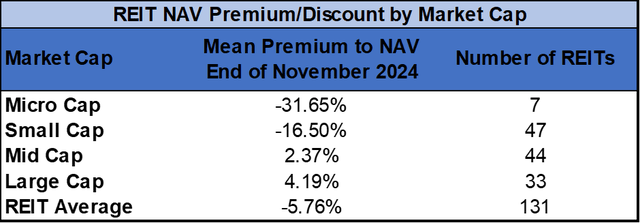
Bankruptcy filings increased month-over-month again in November and more than doubled from November 2023. 2024 has had more bankruptcies YTD than there were in the first 11 months of any other year since 2010.
Source: S&P Global Market Intelligence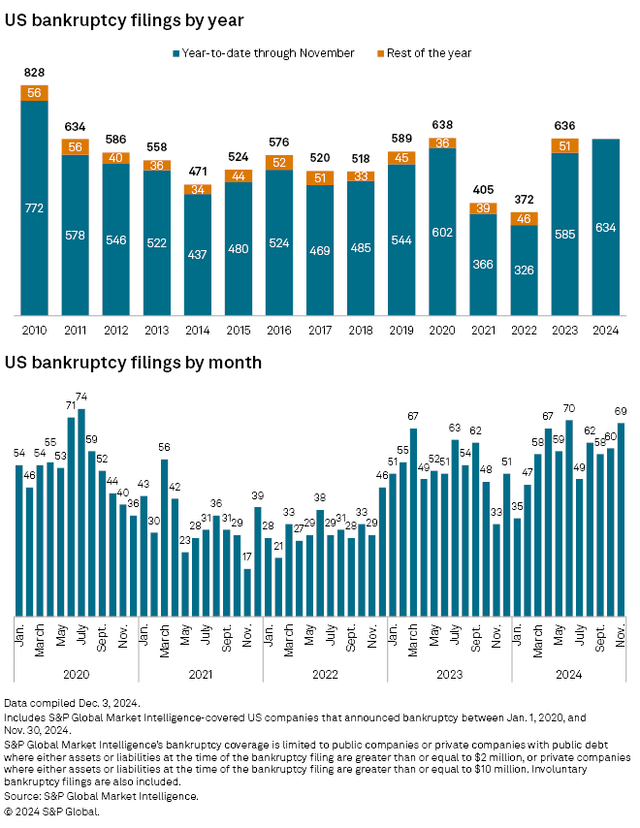
10 REITs announced dividend hikes in November, 9 of which pay quarterly dividends and 1 of which pays monthly. Veris Residential (VRE) (+14.3%) and Strawberry Fields REIT (STRW) (+7.7%) had the largest dividend increases. In total, 71 REITs have announced increases to their dividend during the first eleven months of 2024.
Source: S&P Global Market Intelligence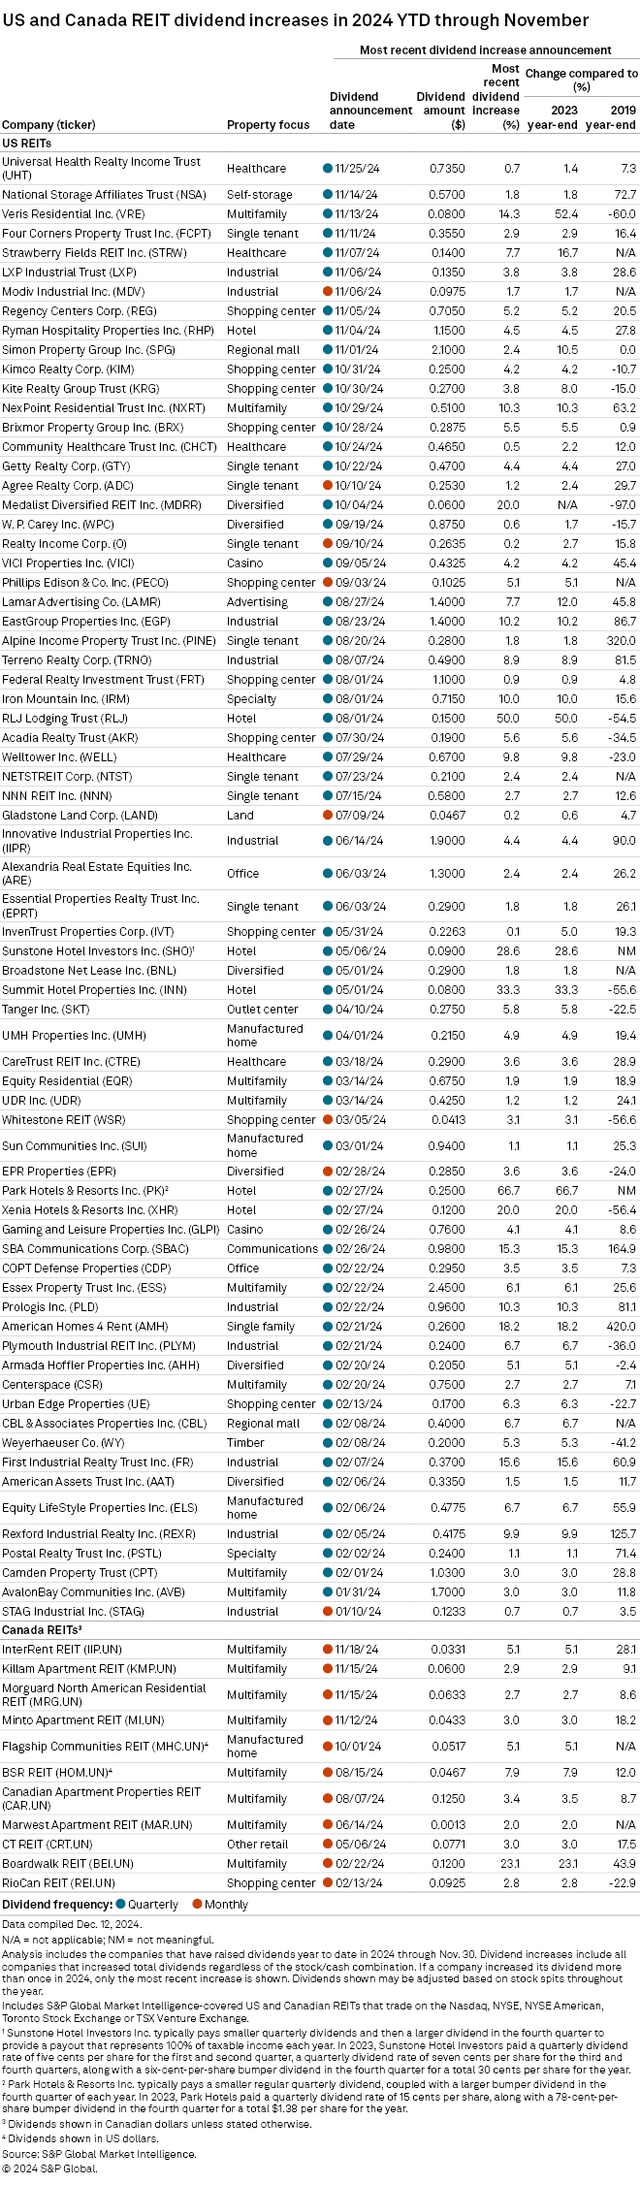
With many REITs seeing a strong rebound in share price over the first three quarters of the year, this presented an opportunity for them to issue additional shares at accretive pricing. REITs leaned heavily into their at-the-market (ATM) programs to accomplish this. Equity REIT ATM usage spiked to a new high in Q3 2024.
Source: S&P Global Market Intelligence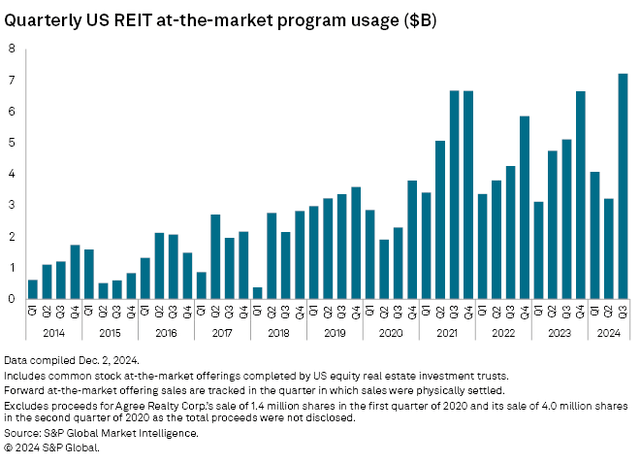
Although ATM programs were utilized to raise capital across many property types, the most proceeds were raised in Q3 by Health Care ($4.65B) and Data Center ($1.78B) REITs.
Source: S&P Global Market Intelligence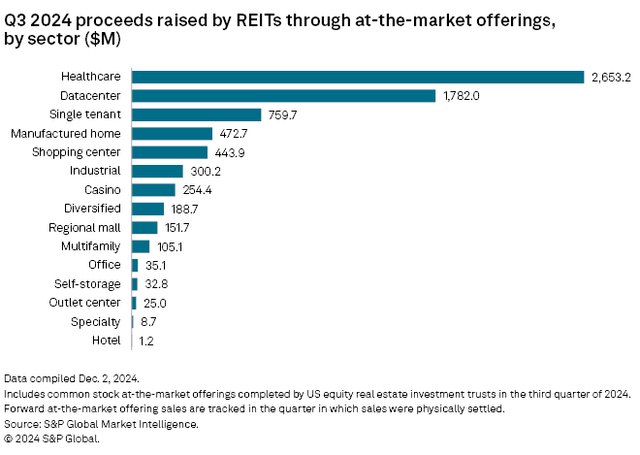
In fact, the 5 largest issuances via ATM in Q3 were all from Health Care and Data Center REITs. Welltower (WELL) had the largest with $1.25B, followed by Equinix (EQIX) with $976M and Digital Realty Trust (DLR) with $806M.
Source: S&P Global Market Intelligence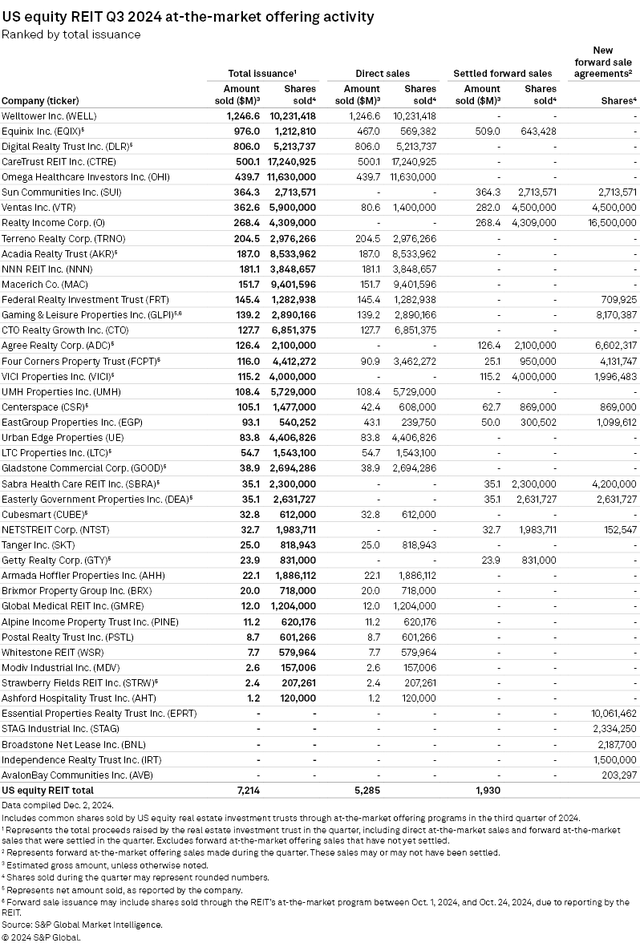
Fed Forecast Shifts Toward Fewer Rate Cuts and Higher Longer-Run Fed Funds Rate
The median longer-run fed funds rate forecast from the Federal Open Market Committee (FOMC) has been revised upward to 3.0%. This marks the highest projected longer-run fed funds rate since 2018.
Source: S&P Global Market Intelligence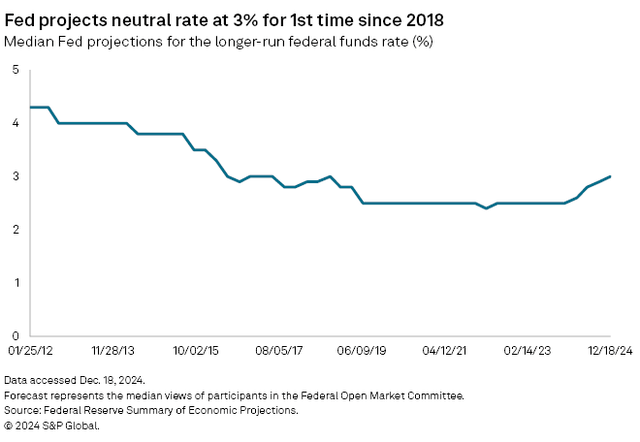
FOMC end of year rate forecasts were also raised for both 2025 and 2026. This updated forecasts amounts to only 50 bps of rate cuts in each of the next 2 years, with the fed funds rate only coming down 100 bps by the end of 2026.
Source: S&P Global Market Intelligence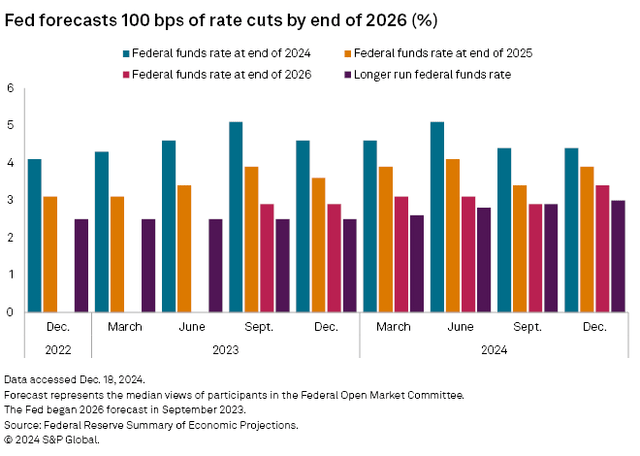
Any revisions to Fed rate forecasts typically elicit a material shift in REIT sector pricing. This is because of the fact that REITs are widely regarded by the market as a rate-sensitive sector due to the impact interest rates have on REIT cap rates and cost of capital. Cap rate compression produces rising REIT valuations. Falling interest rates provide REITs with access to cheaper debt, which can create opportunities for favorable refinancing terms that reduce interest expense. Although the actual pace of cuts over upcoming years is yet to be seen, it is highly probable that interest rates will continue to trend downward, which will provide a strong tailwind for REIT cash flows and valuations going forward.
Editor’s Note: This article covers one or more microcap stocks. Please be aware of the risks associated with these stocks.
Read the full article here