Many investors get into trouble holding popular stocks well after a reasonable valuation disappears. The old Wall Street adage is… you can be a bull or a bear, but don’t be a pig. Greed and arrogance can work during a rising trend, sure. It can also get you into a cycle where you let major trading/investing profits evaporate over a year or two. My trading logic for Microsoft (NASDAQ:MSFT) shares is to lighten up now, as the Big Tech selloff is spreading fast during October.
Rising interest rates as investment competition, a slowing economy, a valuation that doesn’t make much sense vs. realistic math, and an overhyped artificial intelligence [AI] landscape in late 2023, make a serious case to liquidate on this week’s price strength. The pressure to sell Microsoft has been growing day after day, week after week, since late summer. If you remain long, just remember -50% price declines are not uncommon for the overall equity market and individual names, especially after years of wealth gains.
For example, Microsoft declined -65% over 12 months between the end of 1999 and 2000, at the end of the Dotcom Tech boom. Believe it or not, today I find plenty of sentiment (overly optimistic), valuation (amazingly extended) and technical trading (weak buying volume with fading price) similarities to the beginning months of 2000.
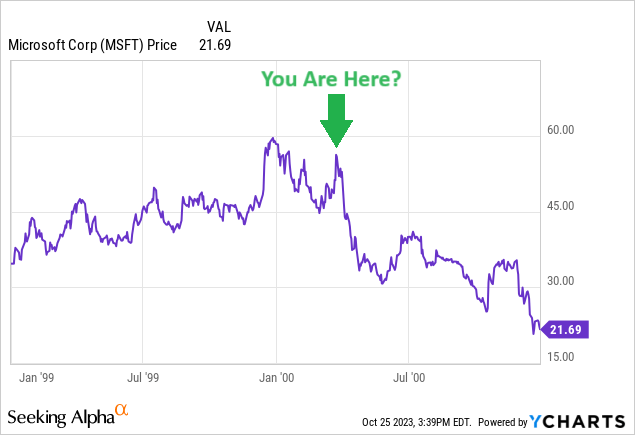
StockCharts.com – Microsoft, 1999-2000 Price Changes, Author Reference Point
Don’t say such cannot happen again! If we are at the cusp of a multi-year recession, where Microsoft is headed toward snowballing disappointment from operations, a -50% or greater decline is not impossible. For prudent investors, why not take some chips off the table? Current “projected” growth rates from the business are above average, but the valuation is already discounting years of good times ahead. What if a recession blunts future business results?
Looking at the macroeconomic backdrop, my view is this is good as it gets for longs. I am downgrading my intermediate-term view from last November’s Hold to Sell. For a 12-month outlook, I expect MSFT to trade flat to lower during 2024.
Extreme Valuation = Nothing Can Go Wrong
In some respects, the overvaluation problem at Microsoft is not any worse than late 2021’s peak. I don’t know if this is much consolation given price to trailing earnings (35x), sales (12x), cash flow (29x), and book value (12.2x) are each DOUBLE the levels of 10 years ago, during the final months of 2013. For sure, these stats are in the growth-stock category.
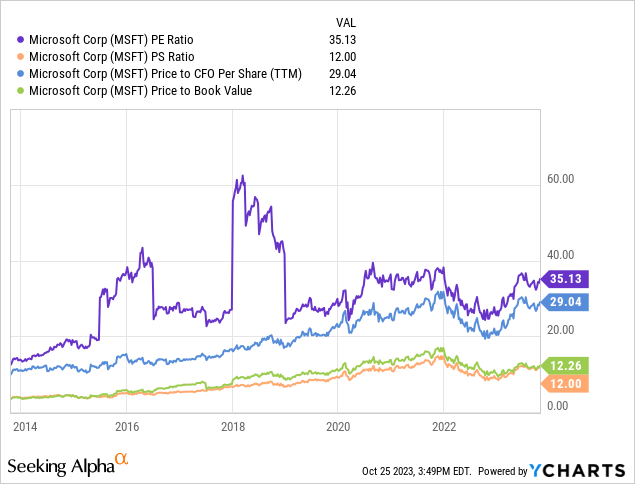
YCharts – Microsoft, Price to Basic Business Fundamentals, 10 Years
When we include changing cash and debt levels over the years, enterprise valuations are an even larger stretch vs. a decade ago. EV to basic cash EBITDA has steadily risen from 8x to 22x today. EV to sales has climbed from less than 4x to 11x. In other words, if Wall Street put the same valuation multiples on company results as late 2013, the current stock quote would be at least -50% lower, in the $150 to $175 range.
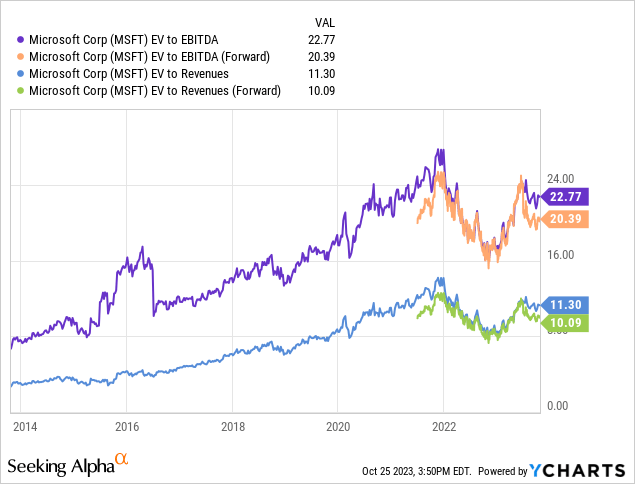
YCharts – Microsoft, Enterprise Valuations, 10 Years
Unfortunately, the interest rate jump since the end of 2021 is now highlighting an extraordinary disconnect between Microsoft’s earnings yield (or free cash flow yield not pictured) and short-term investment yields available from “risk-free” Treasury Bills. If I can capture a guaranteed return of money plus a guaranteed 5%+ return on my money, why do I want to own a company delivering less in returns with NO guarantees?
I have been explaining this conundrum for Big Tech investors since the middle of 2021. While the nominal earnings yield of 2.85% from Microsoft does not look much different than late 2015, a relative comparison to the 1-year Treasury rate is wickedly bad at a negative -2.47%. This adjusted number to risk-free cash investments is the worst since the 1990s tech boom peak into 2001. (Remember this article’s introductory chart?)
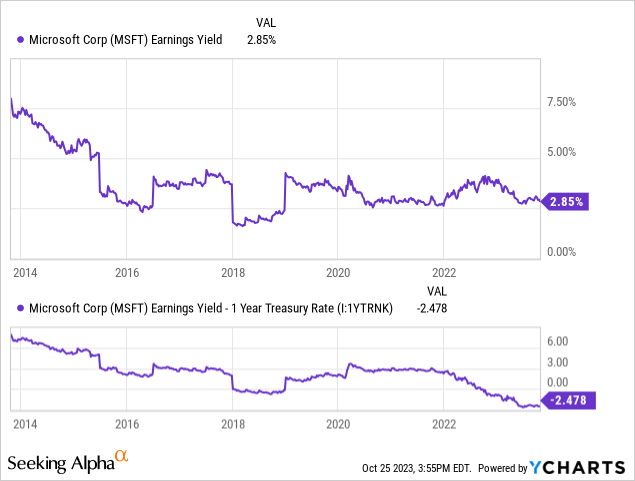
YCharts – Microsoft, Earnings Yield vs. 12-Month Treasury Bill Rate, 10 Years
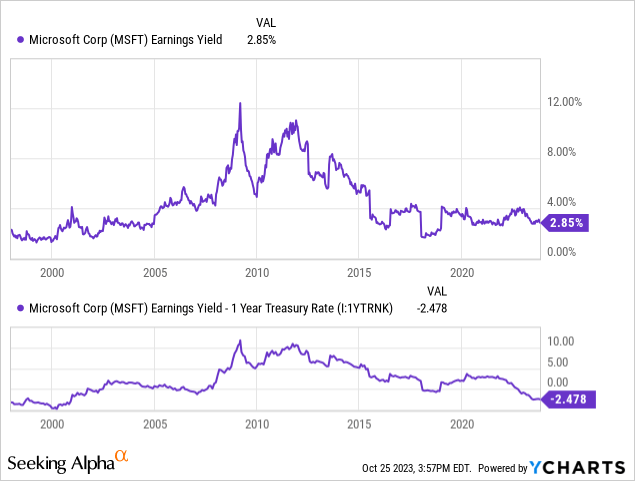
YCharts – Microsoft, Earnings Yield vs. 12-Month Treasury Bill Rate, 25 Years
Microsoft didn’t pay a dividend until 2003. Today’s relative dividend yield stands at one-half the equivalent rate of the S&P 500 index, essentially the worst setup since 2005. Given 40% of all long-term stock market gains in the S&P 500 have come from dividend yield over the last 70 years (4% cash yield, 6% price appreciation to create 10% annual returns), the trailing rate of 0.8% is a complete failure. And, when viewed against CPI inflation of 4% or Treasury securities generating 5%, Microsoft appears incredibly overvalued.
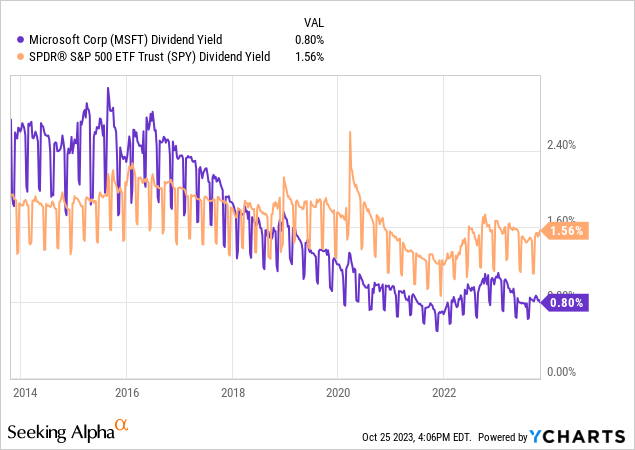
YCharts – Microsoft vs. S&P 500 ETF, Trailing Dividend Yield, 10 Years
Seeking Alpha’s Quant system gives Microsoft an “F” Valuation Grade. When comparing the company’s underlying business metrics vs. peers and competitors on the prices paid to own every stock, MSFT shares can only be labeled as an “avoid” (looking purely at fundamental statistics).
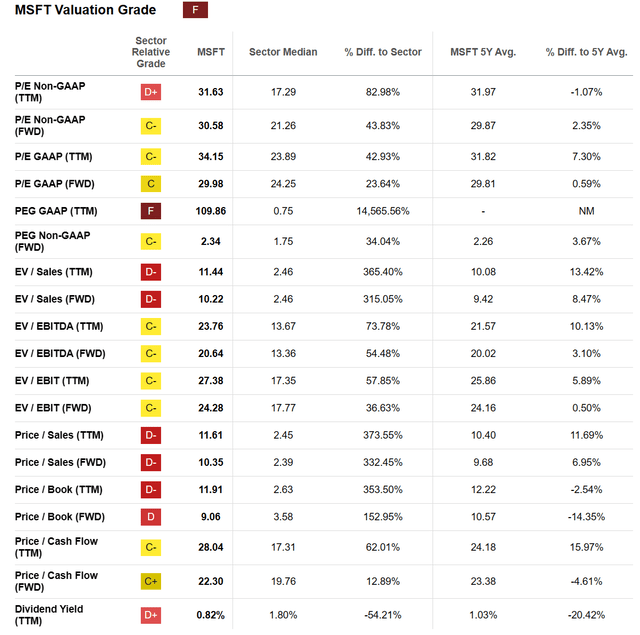
Seeking Alpha Table – Microsoft, Valuation Grade, Made October 25th, 2023
Fading Momentum on Trading Chart
Another issue I have with shares is fading buy momentum. The stock quote did pop recently on strong Q1 FY 2024 results released October 24th.
Yet, actual momentum looks to have peaked between May-July. Indicators such as the Accumulation/Distribution Line and On Balance Volume have not advanced higher for months. In fact, the 20-day Chaikin Money Flow calculation is highlighting a rotten span of net volume buying during a 1-month price gain over parts of September and October (blue arrow). Only the July price top outlined a worse CMF number over the whole chart period drawn below.
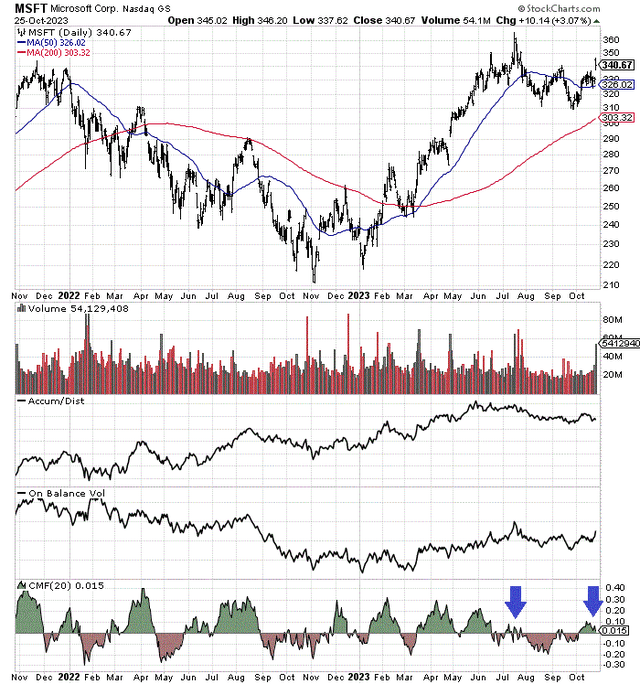
StockCharts.com – Microsoft, 2 Years of Daily Price & Volume Changes, Author Reference Points
You can compare today’s weakness in these 3 momentum indicators and the price pattern to the 2000 period below. I am thinking we are sitting in a similar position to March 2000. (Note: prices are adjusted for 20 years in stock dividends paid starting in 2003.)
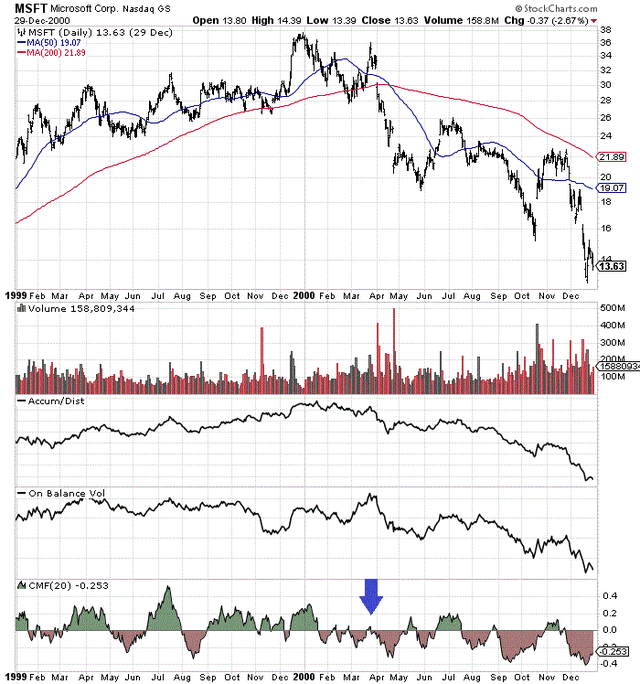
StockCharts.com – Microsoft, Daily Price & Volume Changes, 1999-2000, Author Reference Point
Final Thoughts
If we don’t experience a recession next year, and interest rates come down considerably, Microsoft could stay around current pricing or even be able to rise a little (+10% to +20% for a total return under any bullish scenario in my view). Yet, bulls are counting on nothing breaking. Assuming interest rates remain elevated and earnings/sales disappoint in 2024, considerable downside could become reality, as today’s ultra-bullish optimism over Microsoft is proven “too good to be true.”
I would use the better-than-expected earnings report this week as an excellent opportunity to lock-in some to all of your gains. I firmly believe prices under $300 are coming soon, as I place the odds of recession near 100% moving into 2024. The logic for a recession is piling up… from the inverted Treasury yield curve for over a year, to rare declines in total bank credit and the M2 money supply pulling down loan creation since summertime, to an unexpected jump in crude oil (and inflation) on Middle East turmoil in October.
Current analyst projections of sales and earnings growth rates in the 15% range annually the next few years is possible, but not during a recession in my research. Microsoft’s $2.5 trillion market cap is enormous, meaning outsized growth vs. the overall economy in a stagnation to contraction phase would be quite difficult to achieve. Consequently, the fiscal year (ending in June) consensus numbers forecast into 2026 below may prove overly rosy. I am thinking 10% growth rates in a mild recession and 5% in a deep one may be the “speed limit” for operating business gains.
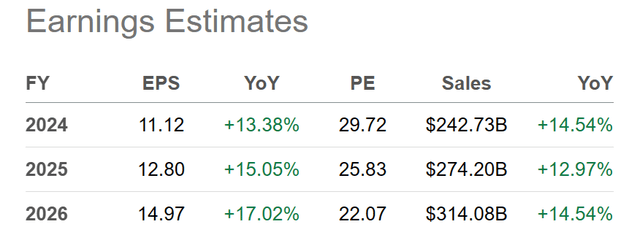
Seeking Alpha Table – Microsoft, Analyst Estimates for FY 2024-26, Made October 25ht, 2023
And, if you are patient, $250 for a share price low in 2024 seems entirely possible during a recession. A -30% price decline from an overvalued favorite is quite common historically during regular Wall Street bear markets of -20% for the S&P 500. At that point, the risk/reward setup may argue for new purchases, as a bull market finds its footing. At $250, with some minor business growth part of the story during the next 12 months, a P/E closer to 20x would offer much smarter value from this mega-cap sized business. We might even get declining interest rates by next summer to support a run to all-time MSFT highs during 2025.
I rate MSFT a Sell until the valuation story improves, and do not have any interest in holding a position.
Thanks for reading. Please consider this article a first step in your due diligence process. Consulting with a registered and experienced investment advisor is recommended before making any trade.
Read the full article here


